
You did twenty laps. Your best was a 49.7. The kid in the next pit did a 49.3 on the same tires, and you've got no idea where those four tenths went.
Your logger does. It recorded every lap from every angle. Reading it is way less complicated than the wall of squiggly lines makes it look. You need maybe four charts, and you can get something useful out of them in the ninety seconds between coming off the track and somebody asking what you want to change.
This guide uses MyChron data, but the ideas work for any kart logger.
What does a kart data logger record?
Most of it comes from two places: the GPS and the wires you've plugged in.
- GPS gives you where the kart was, many times a second. From that you get speed, your line on the track, and the forces: lateral g (how hard you're cornering) and longitudinal g (how hard you're braking and accelerating).
- Sensors give you RPM from the plug lead, and usually exhaust gas temperature (EGT) and water temperature. Some setups add more.
- Lap times come from the logger spotting each time you cross the start line.
That's it. Everything below is just these few things drawn in different ways.
Start with your lap times
Before any chart, look at the list of laps. Two numbers matter more than your best lap:
- How far your typical lap is from your best. If your best is a 49.7 and most laps are 50.4, you don't have a speed problem yet. You have a doing-it-every-lap problem, and that's good news, because you've already shown you can drive the fast lap.
- Which laps to ignore. Out laps, in laps, laps in traffic, the lap you went off. Leave them out of every comparison. Comparing yourself with a lap where you were stuck behind someone teaches you nothing.
Find where on the track: sectors
A sector is a slice of the lap. Split every lap into, say, three slices, time each one, and now "I'm four tenths off" becomes "I'm three tenths off in the middle of the lap." That's something you can actually work on.
Add up your fastest time through each sector, from any laps, and you get your theoretical best: the lap you'd do if you strung your best bits together. The gap between that and your actual best lap is free time. You've already driven every part of it. We wrote a whole post on the theoretical best lap and how to use it.
The speed trace is the chart that matters most
If you learn one chart, learn this one. It's your speed (up the side) along the lap (across the bottom). The peaks are the ends of the straights and the dips are the corners.
For every corner, look at three things:
- Where the line starts falling. That's your braking point. If it falls earlier than on your fast lap, you're braking earlier.
- How low the dip goes. That's your minimum speed through the corner. This is the big one in a kart. Karts don't have much power, so every km/h you scrub off in the corner has to be earned back down the whole next straight.
- How quickly the line climbs out. A slow climb usually means you were late back on the throttle, or the kart was still sliding or bogging when you were.
A really common pattern for newer drivers: braking too early and too much, so the dip is deeper and wider than it needs to be. On the trace it looks like a big "V" where a faster driver has a shallow "U".
Compare two laps
One trace on its own is hard to judge. Two traces on top of each other tell you almost everything. Pick your best lap as the reference and lay another lap over it. Where the lines split apart is where the laps were different.
The other line to watch is the time delta: how far ahead or behind the second lap is at every point around the track. When it climbs, that lap is losing time. When it falls, it's gaining.
Here's the trick: find the first place the gap grows. Lose two km/h through turn three and you'll be slower all the way down the next straight. The delta keeps climbing there, but the straight isn't the problem. Turn three is.
In Slicks you pick two laps and get both speed traces, the delta, and a cursor that moves around the map as you scrub, so you can see exactly where on the track you're looking.
Let the app rank your corners
Doing all of the above for every corner gets slow. Slicks does a version of it for you: it lines every lap up against your fastest and ranks the corners that cost the most, with how many tenths, the speed difference and where on the track. Start with the top one and ignore the rest for now. Fixing one corner per session is a lot more than most people manage.
Look at the track map
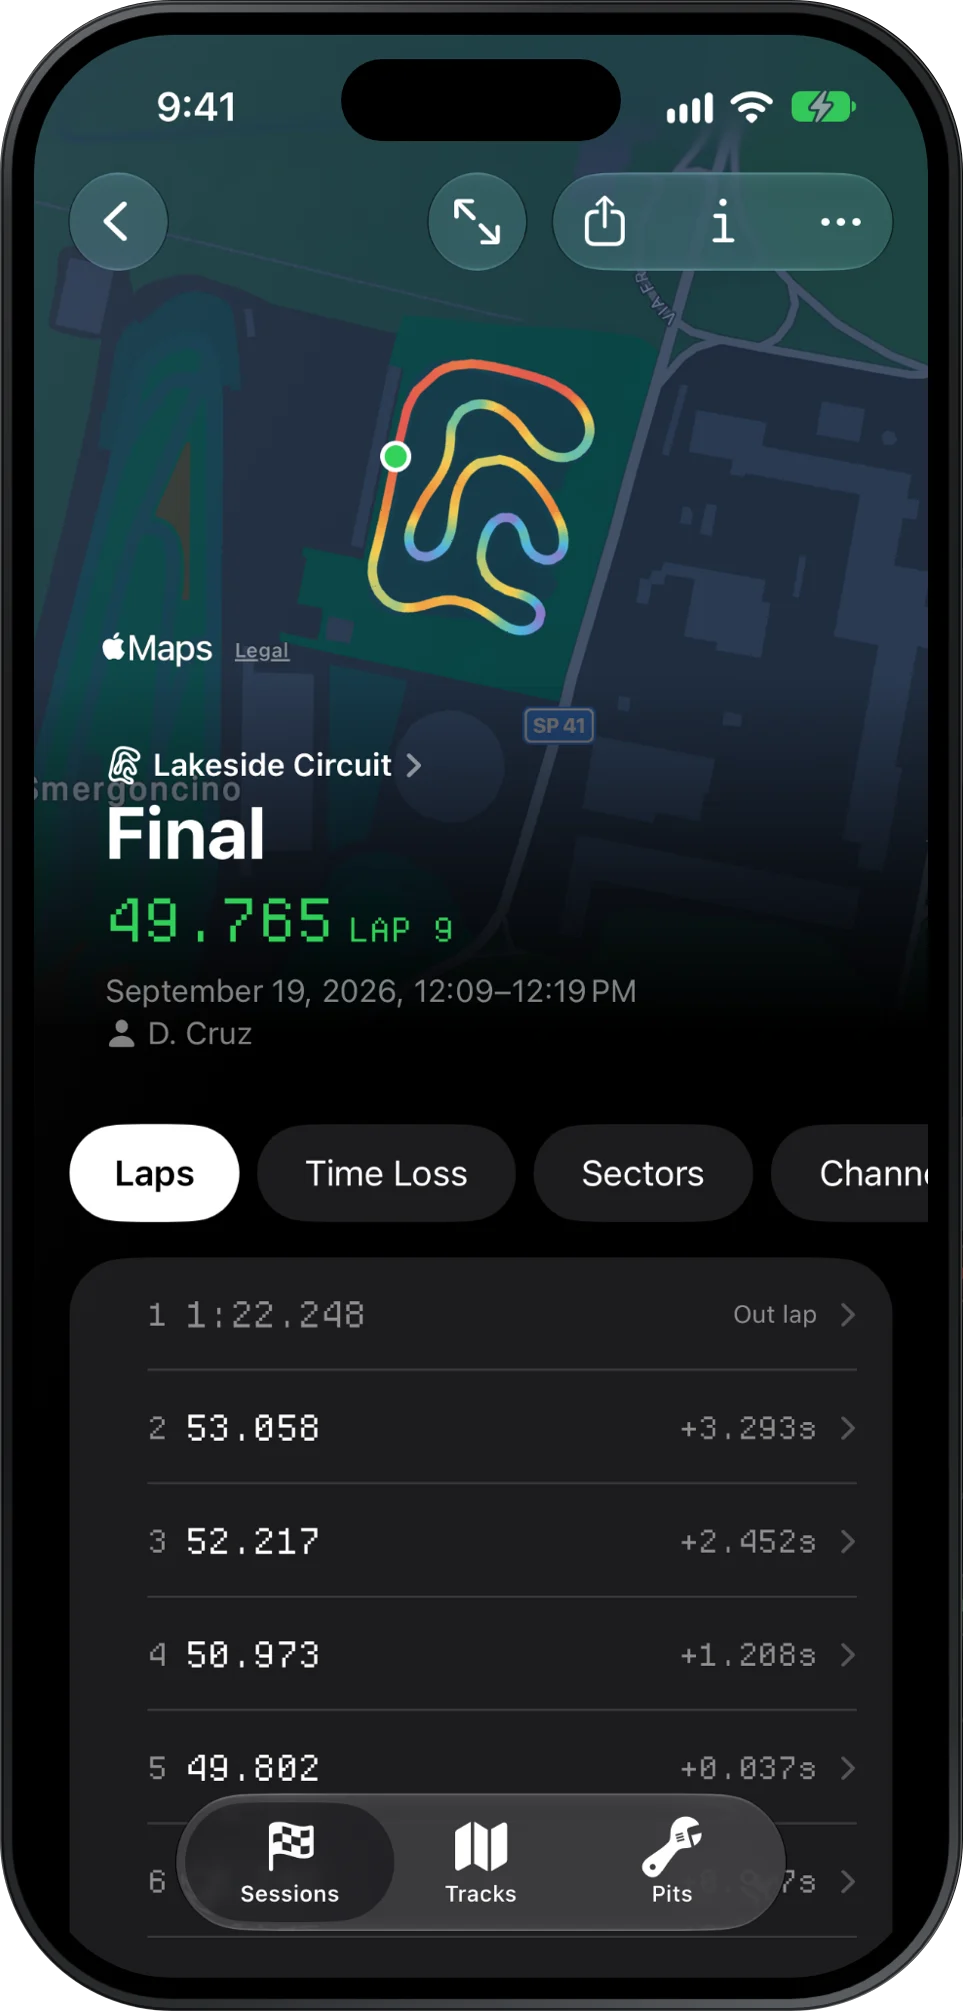
The map shows your laps drawn on the real circuit and coloured by speed. It's the quickest way to get a feel for the whole lap. Change the colour to lateral g and you see how hard you were cornering everywhere. A corner that stays pale while the rest of the track lights up is one you're not committing to.
Check the engine
Your engine builder or tuner usually gives you a window for each reading, so you're mostly checking you're inside it:
- Peak RPM. If you're hitting the limiter well before the end of the longest straight, your gearing is probably too short (a smaller rear sprocket gives you a taller gear). If you never get near the RPM where the engine makes its power, it's probably too tall.
- EGT. Exhaust temperature tells you how rich or lean the engine's running. Too hot can hurt the engine, too cold usually means you're leaving power on the table. This is what carb adjustments chase.
- Water temperature. Too cold or too hot and the engine won't make its best power. Tape on the radiator is the usual fix.
Slicks shows these peaks against your tuner's window in plain words as well as colour, with presets for Rotax, IAME X30 and KA100, Vortex Rok GP and Yamaha KT100.
A 90-second routine between sessions
When you're back in the pits with the next session coming up, do this:
- Best lap and theoretical best. How big is the gap? Has it shrunk since the last session?
- The corner that cost you most. One corner. Look at its braking point and minimum speed on the trace.
- Engine peaks. Inside the window? If not, that's the change to make.
- Write down what you're changing. One thing at a time, so next session you know what worked.
That's all. Save the deep dive for the drive home.
Mistakes everyone makes
- Changing two things at once. Gearing and pressures in the same session, and now you'll never know which one helped.
- Comparing against a traffic lap. Pick clean laps, every time.
- Treating the theoretical best as a target you have to hit. It's a pointer to where the time is, not a lap time you're owed.
- Trusting tiny wobbles. GPS gets a little vague next to tall buildings and under trees. Look at the big shapes, not every small kink in the line.
Try it with real data
Slicks is free for iPhone, iPad and Mac. It opens the XRK files your AiM logger records, MyChron included, with no AiM software. No file yet? Open it with an empty library and tap Try a Sample Session to follow along with a real session. And if your data lives on a Mac, here's how to open AiM XRK files on a Mac.