
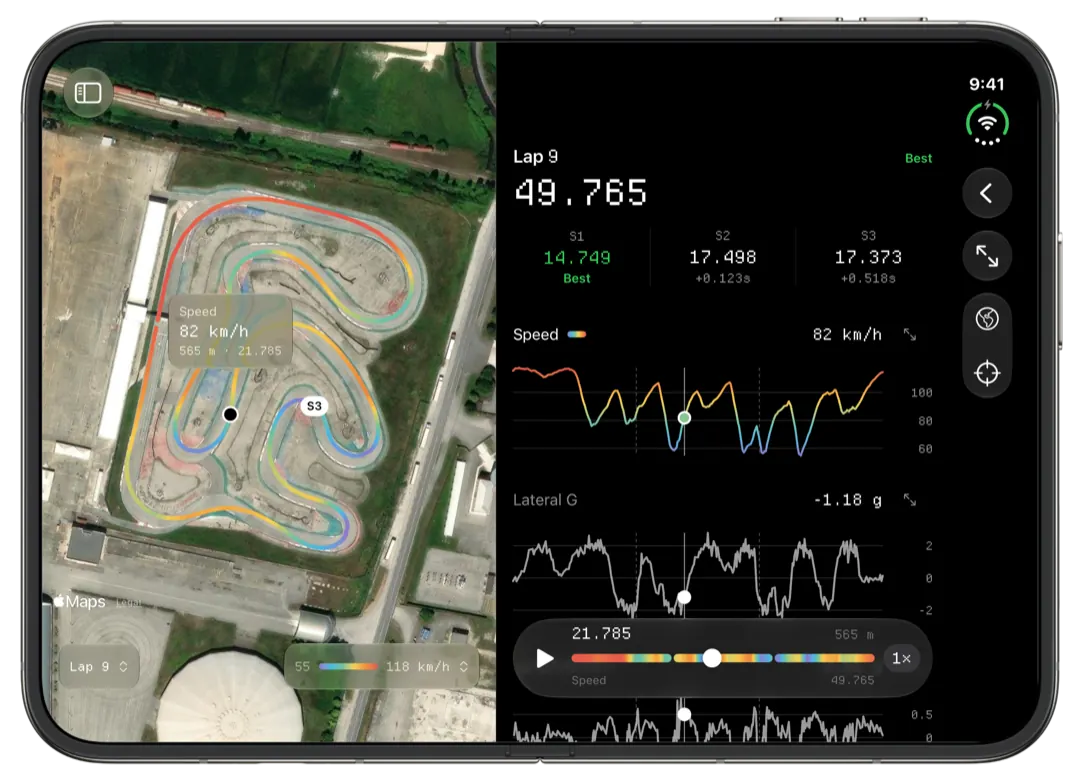
Slicks shows the lateral and longitudinal g of every lap in an AiM or MyChron session, worked out from the logger's GPS, so it needs no extra sensor. Colour the track map by either one, chart it against distance beside speed, and lay two laps over each other to see where one committed harder than the other.
Where the g numbers come from
Your logger records where the kart is many times a second. From that, Slicks works out two readings:
- Lateral g, from how quickly the kart's direction changes at the speed it is going. Tight corner at speed, big lateral g. Left-handers and right-handers show on opposite sides of zero.
- Longitudinal g, from how quickly the speed changes from one GPS fix to the next. Braking and accelerating show on opposite sides of zero.
Fixes with poor accuracy are left out before anything is worked out, so a moment of bad signal is less likely to show up as a spike.
These are good approximations, not lab measurements. Because they are built from positions taken a fixed number of times a second, they are smoothed: a sharp stab of the brake or a kerb strike gets spread out, and peaks read lower than an accelerometer bolted to the chassis would show. That matters less than it sounds. For comparing one lap with another at the same track, the smoothing is the same on both.
What lateral g tells you
Lateral g is the closest thing in your data to "how much grip did I use?" Because it swings one way for left-handers and the other way for right-handers, read it by how far it gets from zero, not by its sign.
- A corner that stays close to zero while others swing far is one where you're not asking the tires for much. On a quick corner, that usually means a lift or a brake you didn't need.
- A shape that drops in the middle of a corner and comes back suggests the kart was slowed mid-corner: a correction, a lift or a slide.
- A plateau held longer on your fast lap than on your slower ones means you carried the load further round the corner instead of waiting for the exit.
Compare the same corner across laps, not one corner against another. A hairpin and a fast sweeper should look completely different.
What longitudinal g tells you about braking
Most karts have no brake pressure sensor, so longitudinal g is your braking trace.
- The start of the braking swing is your braking point. Compare it with the speed trace: they should agree.
- The depth is how hard you braked. A sudden deep swing is a firm stop; a shallow, long one is gentle braking spread over more track.
- The release is how you let go. A clean release that hands over to rising lateral g as you turn in is what you're after. Braking that ends abruptly, then a gap before any lateral g, means a moment of coasting.
On the accelerating side, expect small numbers. A kart has little power for its grip, so the exit shows up as a modest rise, and the speed trace will often tell you more about it.
Colouring the track by g
On a lap's map, tap the colour key at its foot and pick lateral g or longitudinal g. With lateral g the straights take the middle of the ramp, and corners turn toward one end or the other depending on which way they go; the further toward the end, the harder the corner was loaded. With longitudinal g the braking zones stand out at the cool end of the ramp, just before each corner. Hold the map anywhere to read the exact value. More on reading map colours is on the track map heatmap page.
G-force against distance, and two laps at once
Open any lap and its readings are charted against one distance axis, lateral and longitudinal g among them, with one cursor across every chart and the map. Put the cursor at the end of a braking swing and the map shows exactly where you turned in.
In lap comparison, each g reading is drawn as two lines, one per lap. This is where the numbers earn their keep: the faster lap's lateral g in the corner that lost you time is a picture of what "more commitment" looked like in practice.
Raw accelerometer channels from your logger
Many AiM loggers record their own accelerometer channels as well. Those come straight from a sensor on the kart, so they react faster than the GPS values and are noisier with it. On the Mac, the Channels tab charts any channel the logger recorded over time or distance, with zoom and a hover cursor, and the Track tab can colour the map by it. On the iPhone and iPad, the lap screen and its map keep to the GPS-derived g readings.
What Slicks doesn't do with g-force
It doesn't draw a g-g diagram or a friction circle, and it has no math channels, so you can't combine the two readings into total g. For a quick read of how hard the kart was working in each corner, the map and the charts are enough.
