
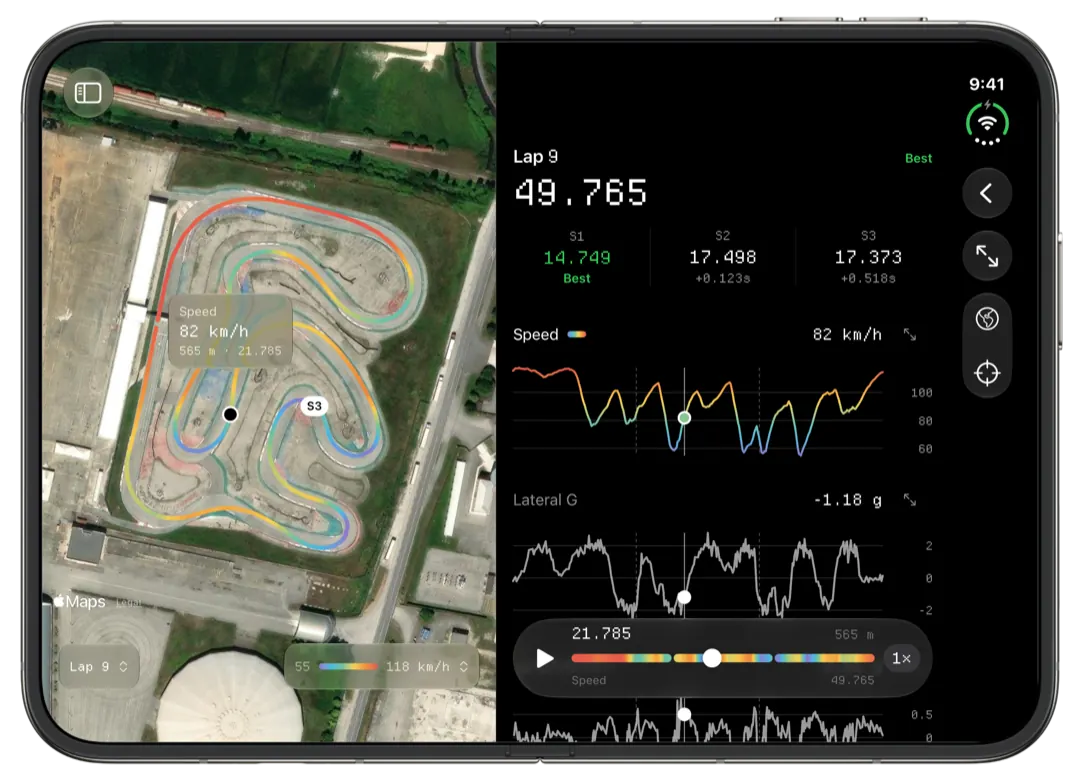
Slicks compares two laps from the same AiM or MyChron session on an iPhone, iPad or Mac. You pick the pair, and it draws both speed traces on one distance axis, the gap between the laps along the whole lap, both lines on the track map, and races the two laps against each other at their real pace.
Which two laps should you put side by side?
The comparison is only as useful as the pair you choose. Slicks always makes the faster lap the reference, drawn in green, and the slower one red. Your job is picking a second lap that teaches you something.
- Best lap against your second best. When two laps are a tenth apart, the differences are small and specific. This shows what made the best one special.
- Best lap against a typical lap. Pick one from the middle of the list, not the slowest. This shows the habit that costs you every lap, which is usually worth more than one good moment.
- Before and after a change. If you tried a later braking point halfway through the session, put a lap from each half together.
Leave out the out lap, any lap in traffic and the one where you went wide. A lap that was slow for a reason you already know only adds noise.
To pick, hold a lap on the Laps page (or tap Compare Laps at the end of the list), then pick the second. A bar sits over the bottom of the screen and opens the comparison once two laps are picked.
Reading the gap chart
The gap chart is the line that does most of the work. It shows how far the slower lap is behind the reference at every point around the track.
- Flat means both laps were going at the same pace there.
- Climbing means the slower lap is losing time.
- Falling means it is getting some back.
Look for the place where the line starts to climb, not where it is highest. Lose a few km/h at the exit of a corner and the gap keeps growing all the way down the next straight. The straight looks guilty on the chart; the corner before it is the cause. Put the cursor where the climb begins and the map shows you exactly which corner that is.
Above the charts, the per-sector gains break the same story into pieces, so you can see at a glance whether the time went in one place or leaked away everywhere.
Two speed traces on one axis
Under the gap, each reading is drawn as two lines against the same distance: speed, lateral and longitudinal g, altitude, RPM and the temperatures your kart logged. One cursor reads both laps at the same place on every chart.
On the speed chart, take each corner in turn:
- Where the lines drop. The one that falls first braked first.
- How low each one goes. The minimum speed in a corner is where a kart wins or loses most, because there is not much power to get it back.
- How fast each climbs out. A slower climb means you were later to full throttle, or the kart was still sliding.
If the two speed lines sit on top of each other through a corner but the gap still grows there, look at the map: one lap probably took a longer line.
Maps side by side, or one map with two lines
The maps come two ways, and each answers a different question.
Side by side, each lap is drawn in shades of its own colour on one shared range, so a corner that is darker on one map was taken faster. This is the quickest way to spot where the speed differed.
Overlaid, both laps are thin lines on one map, green and red. This is for the line itself: an apex missed, a wider entry, the kart running out to the kerb on exit. Keep in mind that GPS wanders a little, so a line that sits a metre off the other may be the satellites, not you. Trust a difference that holds for several corners or several laps.
Racing the two laps
Press play and the two laps start from the same point, each moving at the pace it was actually driven. You see the gap open on the map as it did on track, at 1×, 2× or 4× real speed. Pause, change the speed, and the gap is kept. Sometimes watching the red dot fall behind in one corner says more than the chart did.
Any chart opens full screen. On an iPhone it turns to landscape; on a Mac it gets its own window, which helps when you want the gap chart large beside the map. For the corners that cost the most across the whole session rather than one pair, see where you lose time, corner by corner. For a primer on reading these charts from scratch, start with our beginner's guide to kart telemetry.
What lap comparison in Slicks can't do
Both laps have to come from the same file. Slicks does not compare a lap from this session with one from yesterday, or your session with another driver's. It also has no video, so you can't watch onboard footage in step with the traces. If you want to see how your fastest sectors add up instead, the sector analysis page covers that.
