
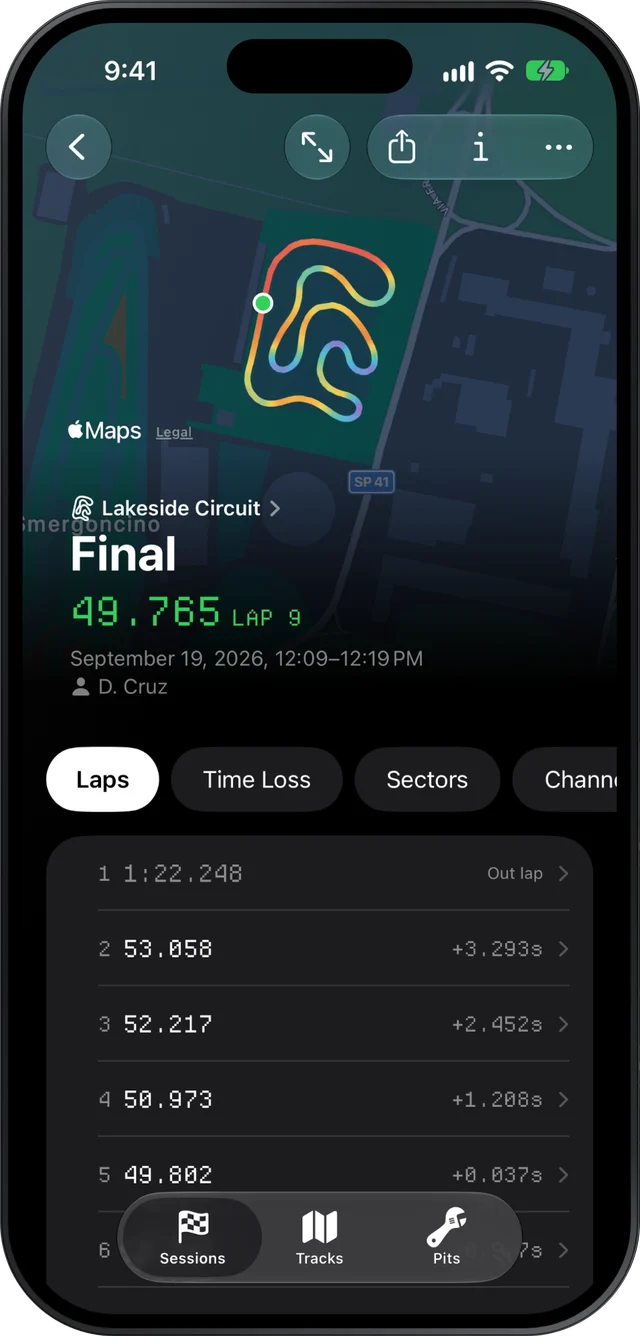
Slicks answers "where am I losing time?" by lining every lap of an AiM or MyChron session up against your fastest, corner by corner. It ranks the corners that cost the most on average and gives three numbers for each: tenths lost per lap, how much slower the slowest point was, and whether you braked earlier or later.
How Slicks finds the corners
There are no corner lines to draw. Slicks takes your fastest lap and cuts it at the top of every straight, the point where the speed peaks just before you brake. Each piece is one corner: the braking zone, the corner itself, and the run out to the next straight.
A few things follow from that:
- A kink you take flat is not a corner. If the kart barely slows, Slicks does not cut there.
- Corners are numbered in the order you reach them, counting from the start line. They may not match the turn numbers on the circuit's map.
- The last corner before the line is kept whole, even though the lap ends in the middle of it.
Every other full lap is then cut at the same places and measured against the fastest. The out lap, any lap the logger cut short and the fastest lap itself are left out.
How the corners are ranked
For each corner, Slicks averages what the other laps lost there against the fastest. A corner where they lost 0.12 s on average sits above one where they lost 0.05 s. Corners where the other laps were, on average, as quick or quicker are dropped from the list.
Ranking by the average matters. A corner that costs a tenth on every lap is worth far more over a race than one where you had a single big moment. Because one spin still pulls a corner's average up, the list also remembers which lap lost the most there, so you can check.
The three numbers on each corner
Every corner on the Time Loss page carries:
- Tenths lost per lap. The average time the other laps gave away through that corner. This is the ranking.
- The minimum-speed difference. How much slower, on average, the other laps were at their slowest point in the corner. In a kart this is often the one that matters most.
- The braking point shift, in metres. Whether the other laps started slowing earlier or later than the fastest one did.
Read together, the numbers usually point to a cause:
| What the numbers say | What it often means |
|---|---|
| Braked earlier, slower minimum | Too much braking, too soon. Brake later and lighter. |
| Braked at the same place, slower minimum | The entry or the line is costing speed: turning in too sharply, or scrubbing the front |
| Braked later, slower minimum | Over-driving the entry and paying for it mid-corner |
| Same braking, same minimum, still losing | The exit: later back to full throttle, or the kart bogging down |
These are starting points, not verdicts. The traces will tell you which one it is.
Why the phone shows only three
On the phone the list stops at the top three corners on purpose. Between sessions you have a few minutes and one set of hands. Fixing the worst corner is realistic; working on seven at once usually means fixing none of them. When you have sorted the first, the next one moves up.
If you want to see how the time adds up across bigger pieces of the lap instead, the sector analysis page covers the Sectors view.
Opening a corner in Compare
Tap a corner and Slicks opens Compare with two laps already chosen: your fastest, and the lap that lost the most in that corner. The cursor starts at the corner, so the speed traces, the gap chart and both lines on the map are showing the right place straight away.
From there:
- Check the gap chart. If it starts climbing before the braking point, the corner before may be part of the problem.
- Look at both speed traces through the corner: where each drops, how low it goes, how quickly it climbs.
- Press play and watch the two laps go through it at their own pace.
More on reading that screen is on the lap comparison page.
What it can't tell you
Time Loss measures you against your own fastest lap in the same session. It can't show what a faster driver does in that corner, and it can't tell you why a lap was slow if the reason was traffic. It gives you the numbers; it does not write coaching advice. A lap with a different line can also lose time with an identical speed trace, which is why the map is worth a look before you change anything.
